Otto cycle is one of the gas power cycles invented in the nineteenth century. It is the foundation for petrol engines, which have powered a great number of vehicles. It helps us in utilizing the heat generated by the combustion of fuel to power the engines.
Continue reading to learn more about how it works, the actual cycle, and its parameters such as work done, efficiency, and mean effective pressure.
Contents:
What is Otto cycle in Thermodynamics?
Otto cycle is an ideal thermodynamic cycle consisting of four reversible processes (Two isentropic and Two constant pressure processes) used to convert heat into useful work.
This cycle is the ideal representation of the working of the Petrol engine/SI engine. Hence, many vehicles on the road are the applications of the Otto cycle.
The Otto cycle was invented by German engineer Nicolaus Otto in the year 1876.
The below figure represents the PV and TS diagram for the Otto Cycle.
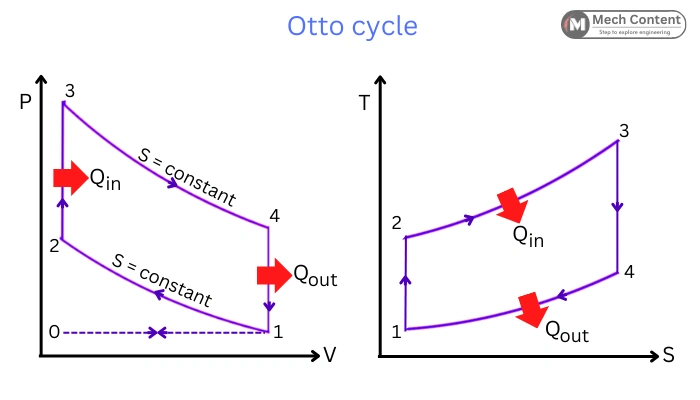
The Ideal Otto cycle comprises the following four reversible processes:
Process 1-2: Isentropic compression
Process 2-3: Constant volume heat addition
Process 3-4: Isentropic expansion
Process 4-1: Constant volume heat rejection.
The cycle also includes two processes: Process 0-1 which represents Isobaric suction of fresh charge, and Process 1-0 which represents Exhaust stroke. These are omitted in the ideal cycle to simplify the analysis.
Here in the cycle, the heat addition and rejection are carried during the constant volume process, Hence this cycle is also known as a Constant volume cycle.
Working of Otto cycle:
Let us look at each of the Otto cycle processes in detail to see how they help convert gasoline into useful work.
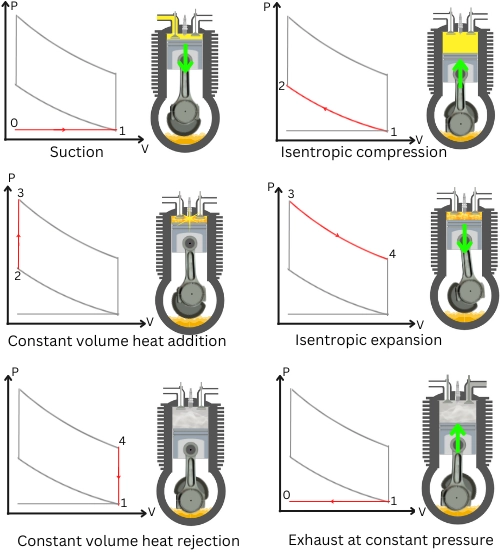
a] Process 0-1: Suction at constant pressure:
During this process, the fresh charge is drawn into the combustion chamber.
b] Process 1-2: Isentropic compression:
The fresh charge is compressed isentropically (reversible adiabatic) to raise the pressure and temperature of the charge. As the process is reversible adiabatic, the heat transfer during this ideal process is zero.
The amount of compression done during this process is the compression ratio (rK) of the cycle which is equal to the ratio of the initial volume (V1) to the final volume (V2).
`r_{K}=\frac{V_{1}}{V_{2}}`
c] Process 2-3: Constant volume heat addition:
During this process, the piston remains steady at TDC, keeping the volume constant. The compressed air-fuel mixture undergoes combustion to generate heat. This results in a rise in pressure and temperature of the working fluid at point 3.
d] Process 3-4: Isentropic expansion:
During process 3-4, the high-pressure working gases undergoes isentropic expansion. During this process of expansion, the pressure of working fluid decreases from P3 to P4 and the volume changes from V3 to V4. The work of expansion is the output work of the otto cycle.
e] Process 4-1: Constant volume heat rejection:
During this isochoric process, the piston remains steady at BDC keeping the volume constant. The working gases rejects heat isochorically to the surrounding. This results in lowering the pressure of gases from P4 to initial pressure P1.
f] Process 1-0: Exhaust at constant pressure:
In process 1-0, the exhaust gases are ejected outside to the atmosphere.
Work done in Otto cycle:
The Net work output from the Otto cycle is the difference between the Work done during Expansion and Work supplied during Compression.
Wnet = WExpansion – WCompression
As per the First law of thermodynamics, for the thermodynamic cycle, the net work done is equal to the net heat transfer in the cycle.
Wnet = Qnet ・・・ Equation-A
Where Qnet is the difference between the heat supplied (QS) and heat rejected (QR) during the cycle.
Qnet = QS – QR = Q2-3 – Q4-1
By putting the Qnet in Equation-A, the Net Work done becomes,
Wnet = QS – QR = Q2-3 – Q4-1
This is the equation for the Net work done by Otto cycle.
To convert the Work done equation in the form of temperature, put the values of Heat transfer in the Wnet equation.
Where the Heat transfer during the Isochoric process 2-3 and 4-1 is given by,
Q2-3 = m.cv.(T3 – T2)
Q4-1 = m.cv.(T4 – T1)
By putting the above values, the Work done equation becomes,
Wnet = m.cv.(T3 – T2) – m.cv.(T4 – T1)
This is the Net Work done by Otto cycle in the form of temperatures.
Thermal efficiency of Otto cycle:
The thermal efficiency of the Otto cycle is the ratio of the Net Work done by the Otto cycle to the Heat supplied.
`\eta_{\text{Otto}} = \frac{W_{\text{Net}}}{Q_{S}}`
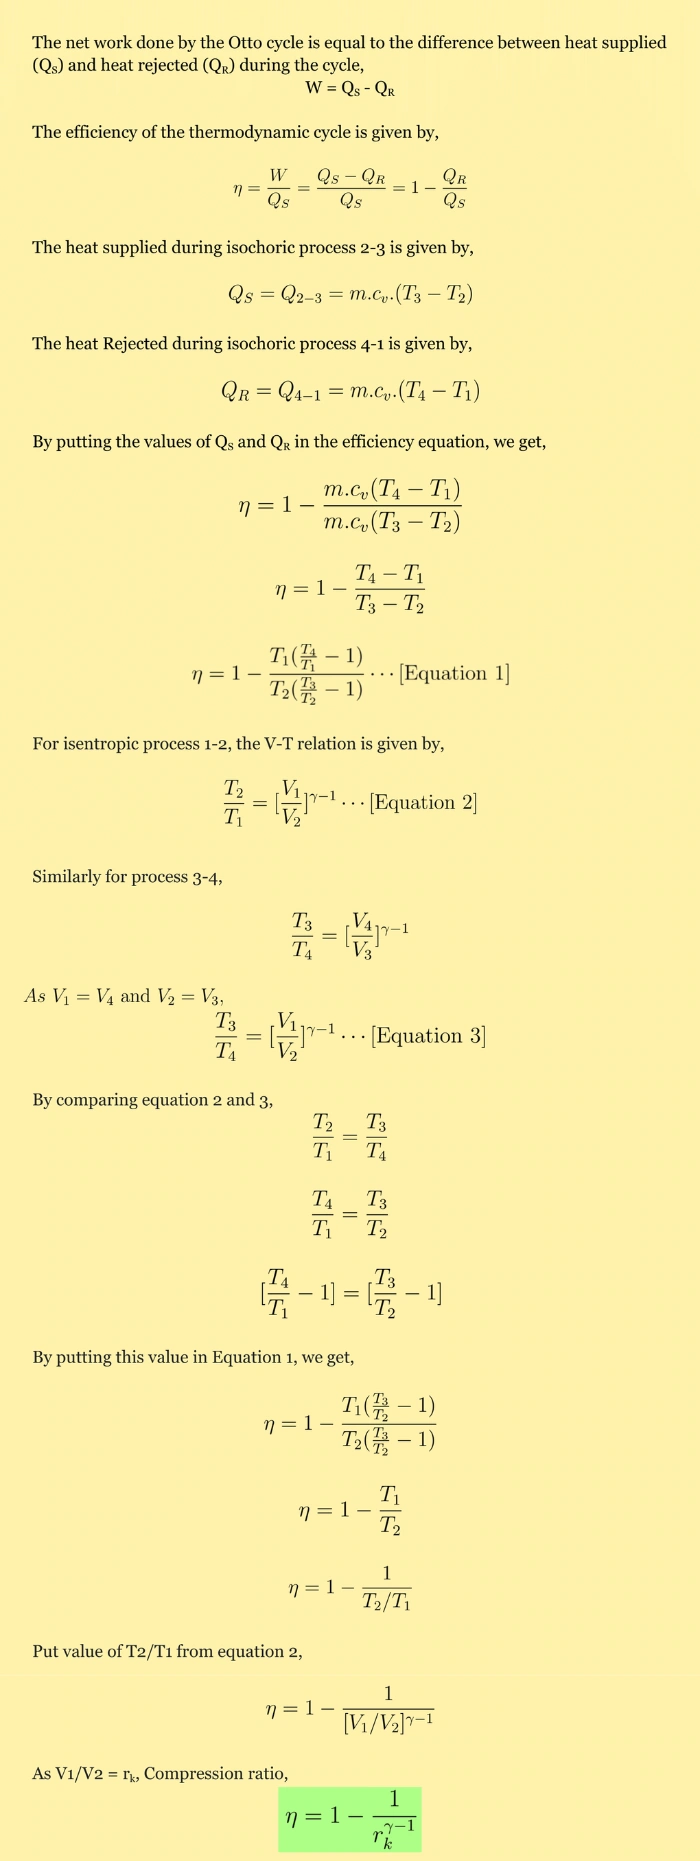
The efficiency in the form of heat transfer is given by,
`\eta_{\text{Otto}} = 1 – \frac{Q_{R}}{Q_{S}}`
This is the equation for the Otto cycle efficiency in terms of heat transfers.
In the form of compression ratio, the otto cycle efficiency is given by,
`\eta_{\text{Otto}} = 1-\frac{1}{r_{k}^{\gamma-1}}`
Where,
`\gamma` = Specific heat ratio
rk = `\frac{V_{1}}{V_{2}}` = Compression ratio
Read the derivation below to know how these formulae are derived.
Mean effective pressure of Otto cycle:
Mean effective pressure (MEP) is the average value of pressure in the cylinder.
If the piston is moved from TDC to BDC by the gas at constant pressure equal to MEP, then the power generated during this process is equal to the power generated by the actual engine in one cycle.
The Mean effective pressure is calculated by the following formula,
`P_{m} = \frac{W_{\text{Net}}}{\text{Swept volume}}`
The Mean effective pressure value (Pm) for the Otto cycle is given by,
`P_{m} = P_{1}.r_{k}.[\frac{(r_{k}^{\gamma-1}-1)(r_{p}-1)}{(r_{k}-1)(\gamma-1)}]`
Where,
P1 = Initial pressure during compression
rk = `\frac{V_{1}}{V_{2}}` = Compression ratio
`\gamma` = Specific heat ratio
rp = `\frac{P_{3}}{P_{2}}` = Pressure ratio during heat addition process.
Actual Otto cycle:
The actual Otto cycle is different from the theoretical Otto cycle due to the assumptions made for the ideal behavior.
The below figure shows the PV diagram for the actual Otto cycle.
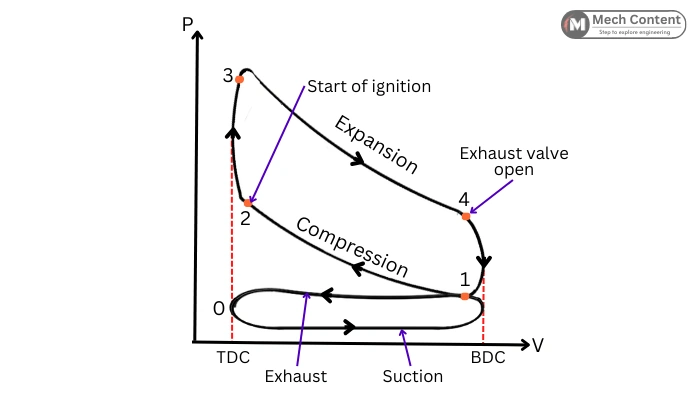
The actual processes of the Otto cycle differ from Ideal processes as follows:
Compression 1-2: In the actual cycle because of the heat loss due to the heat transfer, the compression process is not adiabatic.
Heat addition 2-3: The actual heat addition due to the combustion of fuel is not an instantaneous process. It takes time for the combustion of fuel to raise the peak pressure. Thus, in the actual case, the spark is generated a few degrees before TDC. Hence the peak pressure is obtained a few degrees after TDC (While at TDC during the Ideal cycle).
Expansion 3-4: Due to the loss of heat (due to heat transfer), the expansion is also not an adiabatic process.
Heat rejection 4-1: The heat rejection in ideal cycle occurs instantaneously when the piston is at BDC. But in Actual cycle, the exhaust valve opens few degrees before piston reaches BDC. Therefore, the actual heat rejection starts before BDC.
Factors Affecting Deviations from Ideal Behavior:
The following diagram shows the Ideal and actual Otto cycle on same PV diagram. The area covered by the actual cycle on PV is less than the area of the Ideal cycle.
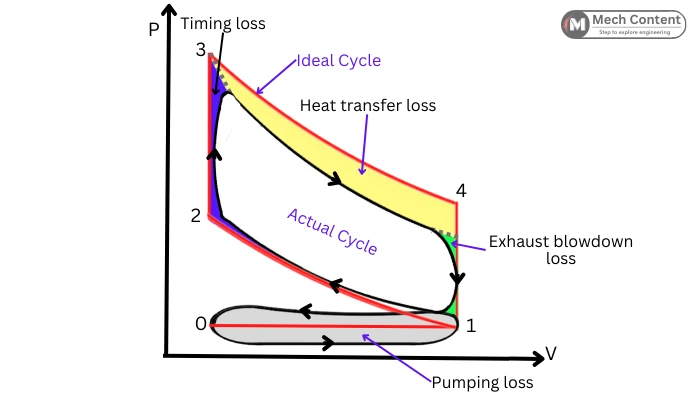
The shape of the actual cycle differs from the Ideal cycle due to the following losses occurring in Actual Otto cycle.
1] Timing loss: The “Blue” portion in the above diagram shows the timing loss. It is because combustion is instantaneous in an ideal process while it actually takes certain time (piston travel) for getting peak pressure.
2] Heat transfer loss: It indicates the heat loss occurs due to the heat transfer to the fins or to coolant. The “Yellow” portion in the above figure indicates heat transfer loss.
3] Exhaust blowdown loss: This loss occurs because in an actual situation, the exhaust valve opens a few degrees before the BDC. Thus, the exhaust gases suddenly rush toward the exhaust manifold lowering the pressure inside the cylinder earlier. The “Green” portion in the above diagram shows the blowdown loss.
4] Pumping loss: These are the power loss that occurs during taking fresh charge and expelling exhaust gases (Grey region).
Due to these losses, the work done by the Actual Otto cycle is less than the Ideal cycle.
Advantages:
The Otto cycle has following advantages:
- It has high thermal efficiency: In comparison with other cycles (diesel, dual) with the same compression ratio and same heat input, the Otto cycle has higher thermal efficiency.
- Uses lower compression ratio: The Otto cycle uses a lower compression ratio. Hence the engines running on the principle of Otto cycle are lighter than other same-capacity engines.
- High power-to-weight ratio: For the same power capacity, the Otto cycle engines are lighter than other engines (diesel) due to their lower compression ratio. Hence it has a higher power-to-weight ratio.
- It can work with different fuels: The engines made on the Otto cycle can run using different fuels like Gasoline, Natural gas, Ethanol, etc.
- Lower cost engines: The engines made on the Otto cycle are less expensive.
FAQs:
-
Who built the Otto cycle?
Otto cycle was invented by the German engineer Nicolaus Otto.
-
What makes the Otto cycle more efficient?
For the same compression ratio and heat supplied, the PV diagram of the Otto cycle covers more area than the Diesel and Dual cycles. More area covered by the PV graph means more work done. Thus, the Otto cycle is more efficient.
-
Is the Otto cycle used in Internal combustion engines?
The Otto cycle is used in Spark ignition (SI) internal combustion engines.
-
Is Otto cycle a reversible cycle?
Yes, The Ideal Otto cycle is considered a reversible cycle.
You may like to read: